The electricity sector has been given higher weight in the recently revised Index of Industrial Production series.
The Central Statistical Organisation (CSO), a body under the Ministry of Statistics & Programme Implementation (MOSPI), announced major changes to the Index of Industrial Production (IIP), on May 12, 2017. This article tries to discuss the subject in the context of the electricity sector.
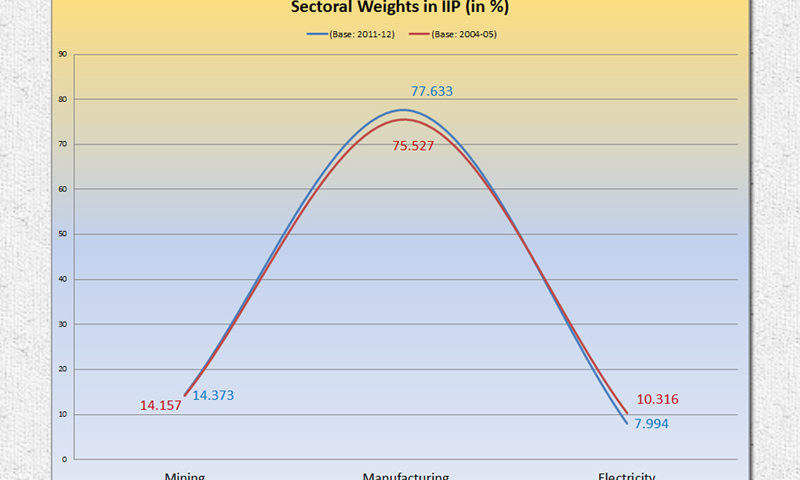
The most important change has been the shifting of the base year from 2004-05 to a more recent year, 2011-12. Such shifting makes the calculation of the IIP more in tune with current economic dynamics. The other big change is the increase in the weight of the electricity sector (which means electricity generation) from the earlier 7.994 per cent to 10.316 per cent. The weight of a sector in the IIP broadly suggests its relative importance, measured in terms of value addition, in the overall industrial production. It is worth observing that electricity generation—largely an enabler of industrial production—is itself becoming an important contributor to industrial production.
Sectoral Weights in IIP
(per cent)
|
| Sectoral |
New Index
(Base: 2011-12)
|
Old Index
(Base: 2004-05)
|
| Mining |
14.373
|
14.157
|
| Manufacturing |
77.633
|
75.527
|
| Electricity |
7.994
|
10.316
|
| Total |
100.000
|
100.000
|
Another point worth noting is that “electricity generation” that was used in the calculation of the IIP till now, was based on only conventional sources—thermal, hydropower and nuclear. Henceforth, generation from renewable energy sources (e.g. wind, solar, biomass, small hydropower, waste-to-energy, etc) would also be taken into account.
Generation from renewable sources recorded an impressive year-on-year growth of 25.5 per cent in the first eleven months (April to February) of FY17, according to latest official statistics. Generation in the said period was 75,949 million kwh as against 60,513 million kwh in the April-February period of FY16. By the same comparison, growth in conventional electricity generation was 4.2 per cent. What is also worth mentioning is that the share of renewable energy generation in total electricity generation improved 6.7 per cent in the April-February period of FY17 from 5.6 per cent in FY16. More than the year-on-year growth rates, which may seem amplified by a low-base effect, it is the share in total electricity generation that reflects the growing importance of renewable energy (RE) generation.
Not the full series
A fine point that may be discussed here is that due to data limitations, the new IIP series has included RE generation with effect from April 2014 only. This means that the IIP series for electricity, for the years FY13 and FY14, are the same as the old series. Due to this “abrupt” inclusion of RE generation, the growth in the IIP for electricity for FY15 shows a spike of 14.8 per cent, as against 8.4 per cent measured by the old series. It may be mentioned here that since 2011-12 (or FY12) is the base year, the IIP for each of the months of that year is set as 100.
Growth in IIP for Electricity
(year-on-year % change)
|
| Year
|
Old Index
(Base: 2004-05)
|
New Index
(Base: 2011-12)
|
| 2012-13 |
4.0
|
4.0
|
| 2013-14 |
6.1
|
6.1
|
| 2014-15 |
8.4
|
14.8
|
| 2015-16 |
5.7
|
5.7
|
| 2016-17 |
4.7
|
5.8
|
Significant change in perception
Due to the changes in the IIP composition, the perception of overall industrial growth has altered significantly. For instance, in FY17, industrial growth as suggested by the old IIP was a depressed 0.7 per cent. Now, growth measured as per new IIP series, is a much more respectable 5 per cent. Also, in FY14, industrial production was believed to have shrunk by 0.1 per cent based on the understanding derived from the old IIP series. Thanks to the revised series, industrial growth in that year stands at a commendable 3.4 per cent.
Contribution of electricity
Based on the revised series, the overall IIP grew by 5.0 per cent in FY17 as compared with 3.4 per cent in FY16. By the same comparison, the IIP for electricity was up only marginally from 5.7 per cent in FY16 to 5.8 per cent in FY17. Though the growth in electricity generation was rather flat, the electricity sector made a higher contribution to growth in overall industrial production during FY17. This contribution stood at around 20 per cent in FY17 as against 14 per cent in FY16.